Salesforce Apex, LWC and Java Flow Analyzer › Guides › Apex call hierarchy
How to trace an Apex method call hierarchy
When you need to know what a method actually does — every method it calls, and what those call in turn — jumping between .cls files is slow and error-prone. A recursive call-flow chart follows the whole chain for you. Here's how to trace an Apex call hierarchy visually.
Trace a call flow in 3 steps
- Load your project in Salesforce Apex, LWC and Java Flow Analyzer (Open Folder, or drop the relevant
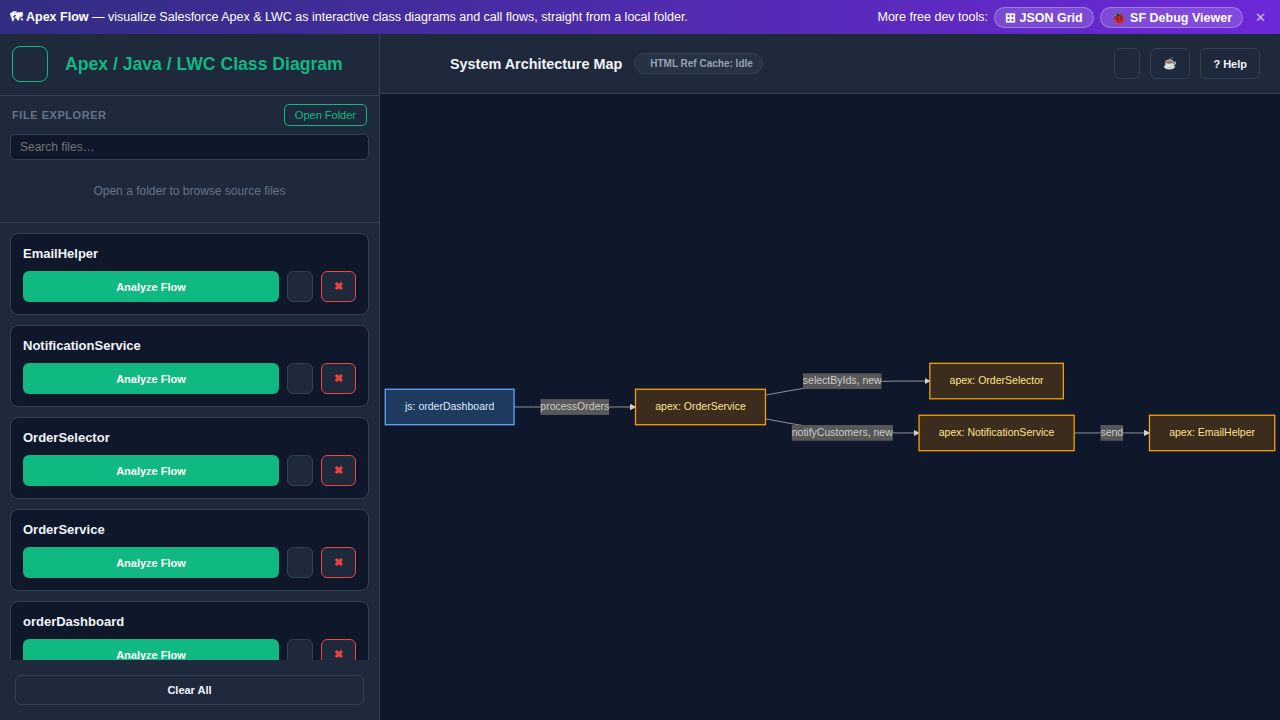
.clsfiles) so the classes are indexed. - Open a class and pick a method. Use Analyze Flow to start a call-flow chart rooted at that method.
- Follow the chain. Salesforce Apex, LWC and Java Flow Analyzer expands the methods it calls recursively — up to six levels deep — and you hide or show each edge's children to keep the picture focused on the path you care about.
What makes the call hierarchy readable
- Recursive, up to 6 levels deep — the chart keeps following calls so you see the real reach of a method.
- Per-edge hide/show — prune branches you don't need instead of drowning in nodes.
- Ghost nodes for classes not yet loaded, so the chain stays visible even before everything is indexed.
- View source inline — open any node's method body in a highlighted modal without leaving the diagram.
Great for impact analysis before a change: trace the method you're about to edit and you can see, at a glance, everything downstream it touches.
Frequently asked questions
- How do I trace an Apex method call hierarchy?
- Load your project, open a class, and run Analyze Flow on a method. It builds a recursive call-flow chart following that method's calls several levels deep, so you see the full chain without switching files.
- How many levels deep can the Apex call flow go?
- Up to six levels. You can hide or show the children of each edge to keep the chart readable as it expands.
- Can I see the source code while following the call flow?
- Yes — open any node in a syntax-highlighted source modal, and copy the underlying Mermaid definition if you want to reuse the diagram.