Apex / Java / LWC Class Diagram — Features & Usage
At a Glance
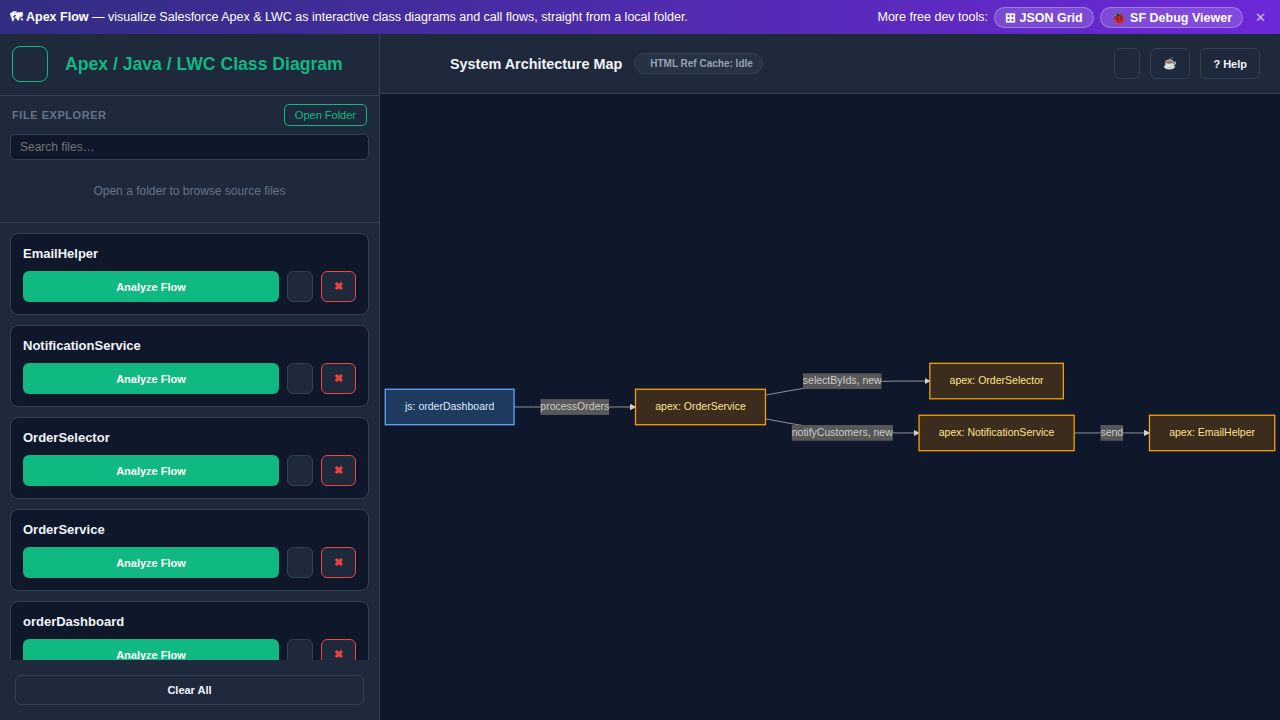
Visualize how your Apex, Java, and LWC source connects. Loading files auto-builds a system-level dependency map; from there you can drill into a single class's call flow, expand referenced "ghost" nodes on demand, and read the underlying code without leaving the diagram.
Tip: use the ▶ Load sample button in the toolbar to render an example architecture map instantly.
📷 Example screenshot — sample Apex classes and LWC rendered as an architecture map
👁 Visitors: … · ☕ Buy me a coffee
1. Open folder / drop files →
2. Read the architecture map →
3. Right-click a node → Analyze Flow →
4. View Code / Source
Loading Files
Open FolderClick "Open Folder" to pick a project root; the handle is remembered across sessions via IndexedDB
Drop filesDrag .cls, .java, .js, or .html files anywhere onto the page; a green overlay confirms the drop target
File explorerBrowse the folder tree in the sidebar and click any file to load it into the diagram
↺ ReopenReopen the last-used folder without re-picking it in the browser dialog
⟲ Re-indexForce a fresh scan of the folder when files have changed since the last session
🕐 HistoryRecently opened files appear in the history popover for quick reload
Architecture Map
Auto-renderLoading any file regenerates the system-level Mermaid.js dependency diagram automatically
Node colorsOrange = Apex · Blue = LWC · Purple = LWC child · Green = HTML-only
Ghost nodesDashed-border nodes with ? prefix are referenced but not yet loaded; right-click → Load Class
Edge labelsHover a truncated edge label to see the full method / import list as a tooltip
Hide/ShowToggle the eye icon on a class card or use the sidebar to remove it from the diagram
Copy ⎘Click Copy Mermaid to copy the current diagram definition to clipboard
Node Right-click Menu
Analyze FlowSwitch to a focused call-flow diagram for this class (up to 6 levels deep)
Load ClassLoad an unloaded ghost node from the file index or a file picker
Hide ChildrenHide or reveal this node's outgoing edges and destination nodes without a full re-render
Hide JS/Apex/HTMLPeel off child edges by type — e.g. hide Apex callouts while keeping JS imports visible
View CodeOpen the method body in a draggable, resizable code panel with syntax highlighting
View SourceOpen the full file (or concatenated .js + .html for LWC) in a centered modal
Analyze Flow Mode
Entry methodSelect a class in the sidebar, then enable one or more entry methods using the pill toggles
Call depthRecursive call chains are traced up to 6 levels; nodes are grouped into per-class subgraphs
Right-click nodeCollapse or expand child subtrees; Load Class to expand ghost nodes in-place
Back to OverviewClick "Back to Overview" to return to the full system architecture map
Diagram Navigation
ScrollMouse wheel zooms in/out; click-and-drag pans the diagram
Edge right-clickRight-click an edge to see the full list of method calls or imports on that relationship
☰ sidebarClick the hamburger button to collapse the sidebar and maximize diagram space; diagram auto-resizes
LWC & Apex Support
LWC bundlesLoading a .js file inside an lwc/ folder also loads its paired .html template automatically
Rel. imports./relative JS imports are parsed and added as child nodes (namespaced as parent.child)
<c-tag>HTML <c-foo-bar> component references are detected and shown as diagram edges
@sf/apex@salesforce/apex/ClassName imports connect LWC components to their Apex controllers
Apex indexLWC count and Apex class count are shown as badges in the file explorer header after indexing
File Search & Keyboard
Search filesType in the "Search files…" box to filter the file tree; ↑↓ to navigate, Enter to load
Drag fileDrag a file from the explorer to the diagram area to load it without clicking
EscClose this help panel, the code viewer, or any open context menu
Clear AllThe "Clear All" button in the sidebar reloads the page and resets all loaded classes